Richest Cities in New Jersey (2025)
by Kristen Carney ![]()
Updated: December 17, 2024
Richest City in New Jersey
The richest city in New Jersey is Mantoloking in Ocean County with an average household income of $484,326 as of 2023. While exceptionally affluent, Mantoloking only has a population of 332 as of 2023. The richest city in New Jersey with at least 5,000 people is Millburn in Essex County with an average household income of $424,832 as of 2023 and 21,859 people as of 2023 according to the most current Census data available (citation).
| Rank | City | County | Population | Average Income | Median Income |
|---|---|---|---|---|---|
| 1 | Mantoloking | Ocean | 332 | $484,326 | $250,001 |
| 2 | Saddle River | Bergen | 3,368 | $430,209 | $236,985 |
| 3 | Millburn | Essex | 21,859 | $424,832 | $250,001 |
| 4 | Rumson | Monmouth | 7,178 | $405,122 | $250,001 |
| 5 | Ho-Ho-Kus | Bergen | 4,232 | $397,531 | $250,001 |
| 6 | Alpine | Bergen | 1,750 | $389,568 | $250,001 |
| 7 | Mendham township | Morris | 5,989 | $381,677 | $250,001 |
| 8 | Essex Fells | Essex | 2,138 | $373,266 | $250,001 |
| 9 | Sea Girt | Monmouth | 1,841 | $359,494 | $206,000 |
| 10 | Upper Saddle River | Bergen | 8,480 | $334,228 | $246,719 |
| 11 | Chatham township | Morris | 11,127 | $329,433 | $223,380 |
| 12 | Fair Haven | Monmouth | 6,109 | $328,614 | $237,132 |
| 13 | Mountain Lakes | Morris | 4,608 | $327,881 | $250,001 |
| 14 | Franklin Lakes | Bergen | 11,021 | $321,350 | $230,987 |
| 15 | Rockleigh | Bergen | 405 | $318,833 | $166,875 |
| 16 | Harding | Morris | 3,891 | $318,455 | $178,810 |
| 17 | Bernardsville | Somerset | 7,837 | $315,101 | $231,006 |
| 18 | Mendham borough | Morris | 4,970 | $312,713 | $223,750 |
| 19 | Chatham borough | Morris | 9,275 | $311,921 | $250,001 |
| 20 | Demarest | Bergen | 4,846 | $308,276 | $175,078 |
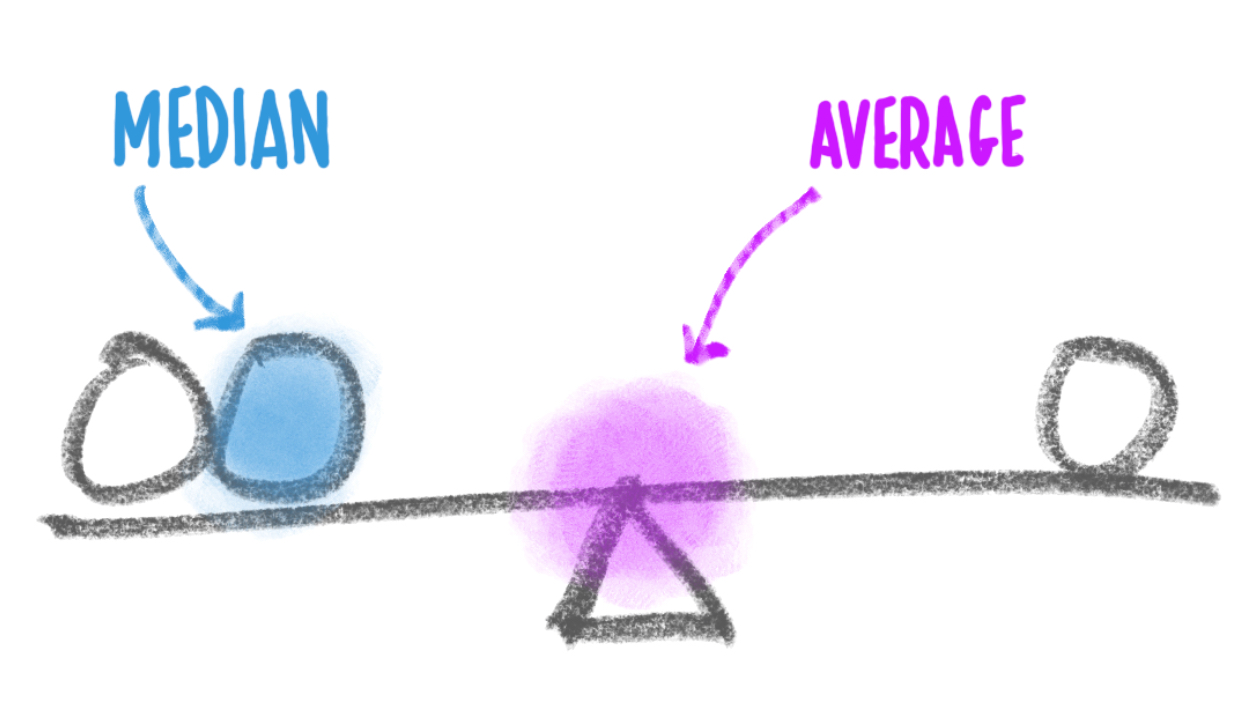
Median Income versus Average Income: Which Should You Use?
We usually suggest using median income data – either instead of or in addition to – average income data as a true indicator of wealth. If you haven’t thought about median versus average since your last standardized test, you aren’t alone. Here’s what they are:
- average is the sum of a set of numbers divided by the count of numbers in the set
- median is the middle number in the set of numbers
Now let’s say you had the following simplified set of income data.
Household 1: $30,000
Household 2: $50,000
Household 3: $1,000,000
The average income for this set is $360,000. The outlier data point ($1,000,000) skews the average WAY up. Conversely, the average income would be skewed WAY down if someone had an income of $500. The median income for the same data set is $50,000. Outlier data doesn’t skew the median.
Most Business Owners Should Use Median Income
So most business owners should use the median income as a true indicator of wealth, because it provides a more accurate representation of a typical income, especially in areas with significant income disparity.
When Should You Use Average Income
If your target market is high-income households, the average income may be more relevant. This is because the average income can highlight the presence of a higher concentration of wealthy individuals, which is beneficial for luxury goods and services marketing. We’re using average income on this page because using the Census’s highest reported median value of $250,001 could result in multiple ties for the richest geography.
Why do so many cities have a median value of $250,001?
The Census' American Community Survey uses $250,000+ as a jam value for median income estimates to protect privacy, ensure data consistency, and simplify reporting. A "jam value" in survey data refers to a placeholder or default value used when actual data points are unavailable, incomplete, or exceed certain thresholds. We represent this jam value as $250,001 to make it easy for you to sort.
You might also be interested in:
Email Me When New Data Are Released
Join thousands of subscribers and receive just 1 (ONE!) email a year in December when the US Census Bureau releases new income data for New Jersey richest cities.
SOURCES
United States Census Bureau. Annual Estimates of the Resident Population: April 1, 2020 to July 1, 2023. U.S. Census Bureau, Population Division. Web. May 2024. http://www.census.gov/.
United States Census Bureau. B01001 SEX BY AGE, 2023 American Community Survey 5-Year Estimates. U.S. Census Bureau, American Community Survey Office. Web. 12 December 2024. http://www.census.gov/.
United States Census Bureau. B19013 Median Household Income, 2023 American Community Survey 5-Year Estimates. U.S. Census Bureau, American Community Survey Office. Web. 12 December 2024. http://www.census.gov/.
United States Census Bureau. “DP03 SELECTED ECONOMIC CHARACTERISTICS.” 2023 American Community Survey 5-Year Estimates. U.S. Census Bureau, American Community Survey Office. Web. 12 December 2024. http://www.census.gov/.
Products & Services
Plumbing
Connect
- 1-800-939-2130
- Contact Us
© Copyright 2025 Cubit Planning, Inc.